 Level2StockQuotes.com
For Day Traders and Investors..
Level II Stock Quotes
US Day Traders and Investors..
Live Stock Charts
Live Stock Charts for Indicators..
TSX Stock Quotes
CA TSX Traders and Investors..
Level2StockQuotes.com - Level 2 Stock Charts and Stock Quotes - News and Watch-List
For Day Traders and Stock Market Investors to do research and keep track of their stocks.. With Live Trading Charts and Quotes, Stock Market News TV, World Charts - Trading Snapshot News Articles, Stock Market Movers and Research, Level 2 Stock Charts and NASDAQ and NYSE Stock Quotes and more...
World Stock Quotes - For USA, Canada, United Kindom, India, Italy, France, Japan, Mexico, Netherlands and Portugal..
For World Indexes and Charts - Global Stock Markets Trading - Snapshot News Articles..
TV - Stock Market News Weather and Sports
Level 2 Stock Charts
World Charts - Trading Snapshot News Articles
US CA Level 2 Mobile
 CA Level 2 Mobile
 FX Level 2 Mobile
US Level 2 Mobile Level 2 stock quotes mobile is setup for all Mobile Devices - Featuring realtime stock quotes on your ipad, iphone or smart phone. Live Stock Charts and Stock Market TV News plus Stock Trading Snapshot News Articles, stock market watch list and day trading tips. For Stock Trading Snapshot News Articles simply select from the Drop-Down Chart Menu above. Use the Stock Market Movers and Stock Screener section to find stocks that are moving fast or have reached a new high or low with volume coming in fast. Forex Trading Currencies see the Forex or FX section in any of the drop-down menus for charts and quotes for GOLD, SILVER or Dollar Rates, Canadian Dollar and many more. For free Level II Stock Quotes click on LII-Book button.
US Live Trading Charts and Quotes
US CA FX Stock Market Movers and Research
Bitcoin - Real Time Bitcoin Price
US CA FX Live Trading Charts - Stock Market Movers - Stock Screener - World Index - COVID-19 Total Cases Map
Level II Stock Quotes
For NASDAQ, NYSE and AMEX stocks. Level II Stock Quotes also features live stock charts, most active stocks and stock market news. For level II quotes click on LII-Book button.
Features free level 2 stock quotes, live stock charts, most active stocks, stock market watch list and stock market news for NASDAQ, NYSE, AMEX stocks. Market hours 4:00 am to 8:00 pm.
Features live stock quotes, stock market watch list, news and live candlestick stock charts for NASDAQ, NYSE, AMEX and OTCBB stocks. You can see what a stock is doing, watch the open and close of the stock trade and compare to the previous trade to give you a better view.
Features real time NASDAQ, NYSE and AMEX, hot Penny stocks that are trading up in today's session and are below $5 dollars with volume coming in moving the stock market price higher. Volume is also an indicator of a stocks momentum and if you get in early, the earnings potential is at it's greatest, just make sure your on the right side of the trade and don't fight against the overall market trend.
Thousands of stock transactions take place everyday, not only in the United States but also all over the world. When a stock is bought and sold, it has two kinds of prices, a bid price and an ask price. The bid price is what someone is willing to pay for the stock.
CA TSX Stock Quotes
Features Free real-time stock quotes - Canadian stock quotes and charts for TSX and TSX Venture Stocks, regular trading hours from 9:30 am to 4:00 pm Eastern Time. Real-Time Stock Quotes.
Features Day-Trading Tips - A Day-Trading Formula that works with any Stock, Day trading tips for using Level 2 Quotes from your broker, this gives you an advantage.
Features a market makers list and brokerage firms, track the big picture, track the buy and sell orders, and the total stock shares traded by the market maker or specialist. For the top online stock brokers see our Online Stock Trading Broker List.
Features Stock Quotes Research, lookup stocks, earnings reports, historical charts, upgrades or downgrades and Insider Trends Buy Hold or Sell indicators. You can also research a stocks trading price current high and low for the day, check stock trading volume yield and change. Lookup stock earnings insider trading information stock announcements, upgrades or downgrades and stock holdings information change in stock ownership.
The futures trading markets are a meeting place for buyers and sellers of many different commodities futures like financial futures, oil futures, gold futures, silver futures, copper futures and many more.
Level II Stock Charts
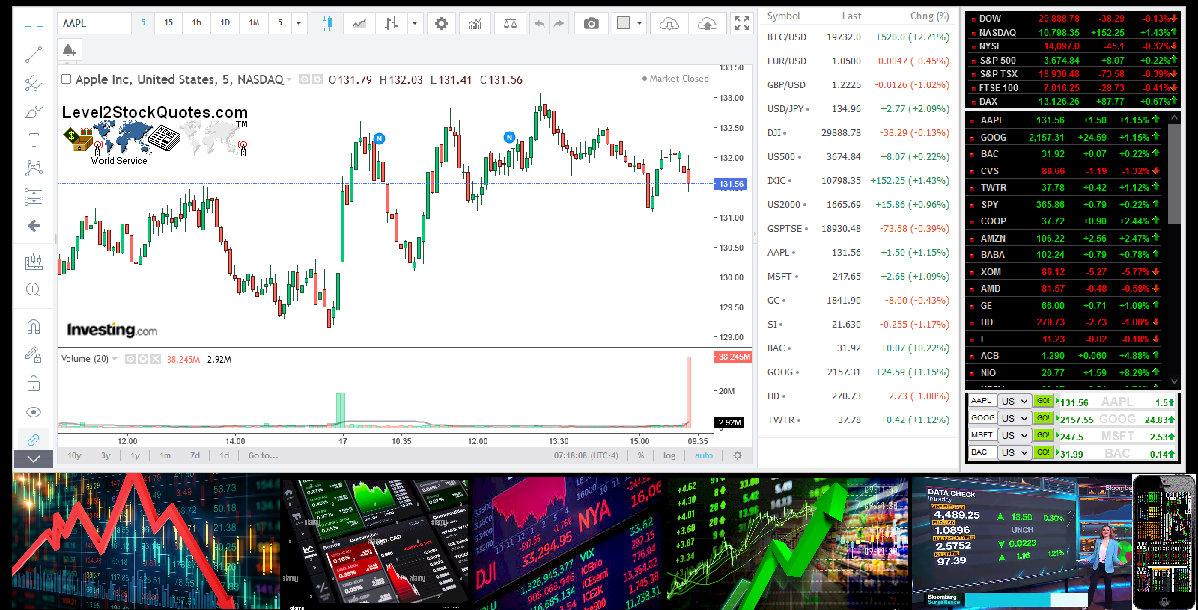
Features live up to the minute stock market charts and stock quotes. Also features live headline news for your stocks and the stock watch-list to keep track of your stocks.
Features live candlestick stock charts, stock chart - Volume, Strength, MACD and Divergence. Pre-market and after market charts. Plus technical analysis for day traders to spot trends.
Features Stock Trading Tips for day traders or investors, Real Stock Trading Tips and advise you can use in today's stock market. The Asian and European markets can be used as a possible guide to get an idea of which direction the US market is likely to go in.
Forex Trading Currency Pairs, Free Quotes and Charts - Forex Trading Currencies features candlestick charts and quotes for XAU/USD - GOLD Dollar Rates, XAG/USD - SILVER Dollar Rates or EUR/USD - Euro Fx / U.S. Dollar, Canadian Dollar and many more currency pairs. Watch for trends spot entry and exit points, view current bid and ask prices.
The trading floor of the futures exchange, with all the shouting and signaling to buy or sell Futures Commodities does give the direct impression of chaos.
Floor Traders - Trader Article for Investors.
Futures Hedging - Hedgers Article the Benefits.
Futures Contract - Futures type of Contract.
Futures Commodities - Futures Commodities
Stock Market Trading Books for Beginners and Professionals:
Most Recent Updates
Clear your Browser Cache
Market Data
Market Data Information
© 2008-2024 Level2StockQuotes.com, Max Handy Gadgets All Rights Reserved.
Copyright and Disclaimer - Privacy Policy
Copyright and Disclaimer - Privacy Policy